What makes a mathematician?
As an educator I often reflect on what characteristics make a good mathematician. Clearly, there has to be a basic level of competence in arithmetic and algebra, the language of mathematics in order to access problems. Far beyond that, at the research level we get into questions of aesthetics, and feeling for what a solution should look like, and having the creativity to approach problems in new ways and draw connections between areas which at first seems disconnected.
At the school level, and for basic problem, a skill which begins to differentiate students in their early teens is the ability to wear bifocal lenses when working on questions. Rather like how good drivers are constantly looking for danger/opportunity both near and far, a mathematician needs to be able to focus on the details of a handful of cases and then step back, sometimes even abstract the problem and place it in a more general context. Progress can be made in both settings, and by oscillating between the two discovery may be accelerated.
Earlier in the year I introduced Happy Numbers as an example of using Jupyter Notebooks to experiment in mathematics, and I return to this idea now.
A number is either happy or it isn’t. There is no obvious way when you first approach the problem to predict how many numbers are happy, and the fact that you are relying on the decimal presentation of a number makes the question rather artifical and messy.
So the first thing we would do is to focus in, play with a few cases, maybe the integers 1 to 10 and see if they are happy.
There is no obvious pattern there (although we notice that there only seems to be two options - numbers are happy or they get trapped in the cycle, … → 4→16→37→58→89→145→42→20→4→…).
We now have a choice, whether to continue in our heads or write some code to check numbers. I went for code, and studied the integers up to 1000:
%matplotlib inline

import numpy as np
import matplotlib.pyplot as plt

def squares(n):
    digits = [int(i) for i in str(n)]
    sum = 0
    for d in digits:
        sum = sum + d**2
    return sum

H = [1]
NH = []

x = []
y = []

n=2
t=1
while t <=10:
    tops = t*100
    while n<=tops:
        k = n
        sqlist = [k]
        k = squares(k)
        while not(k ==1) and not(k in sqlist[:-2]):
            k = squares(k)
            sqlist.append(k)
        if k==1:
            H.append(n)
        if k in sqlist:
            NH.append(n)
        n = n+1
    print("There are"), (len(H)), ("Happy numbers between"), (1), ("and"), (tops)
    x.append(tops)
    y.append(len(H))
    t = t+1
plt.plot(x, y, 'b-', linewidth=2)
plt.show()
print("The Happy Numbers we've discovered are"), H
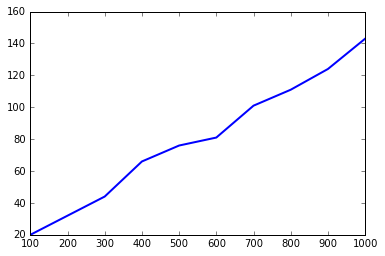
There are 20 Happy numbers between 1 and 100
There are 32 Happy numbers between 1 and 200
There are 44 Happy numbers between 1 and 300
There are 66 Happy numbers between 1 and 400
There are 76 Happy numbers between 1 and 500
There are 81 Happy numbers between 1 and 600
There are 101 Happy numbers between 1 and 700
There are 111 Happy numbers between 1 and 800
There are 124 Happy numbers between 1 and 900
There are 143 Happy numbers between 1 and 1000

The Happy Numbers we've discovered are [1, 7, 10, 13, 19, 23, 28, 31, 32, 44, 49, 68, 70, 79, 82, 86, 91, 94, 97, 100, 103, 109, 129, 130, 133, 139, 167, 176, 188, 190, 192, 193, 203, 208, 219, 226, 230, 236, 239, 262, 263, 280, 291, 293, 301, 302, 310, 313, 319, 320, 326, 329, 331, 338, 356, 362, 365, 367, 368, 376, 379, 383, 386, 391, 392, 397, 404, 409, 440, 446, 464, 469, 478, 487, 490, 496, 536, 556, 563, 565, 566, 608, 617, 622, 623, 632, 635, 637, 638, 644, 649, 653, 655, 656, 665, 671, 673, 680, 683, 694, 700, 709, 716, 736, 739, 748, 761, 763, 784, 790, 793, 802, 806, 818, 820, 833, 836, 847, 860, 863, 874, 881, 888, 899, 901, 904, 907, 910, 912, 913, 921, 923, 931, 932, 937, 940, 946, 964, 970, 973, 989, 998, 1000]
This graph gives us an insight into what is happening, but it is still not clear what conjecture we should make based on this.
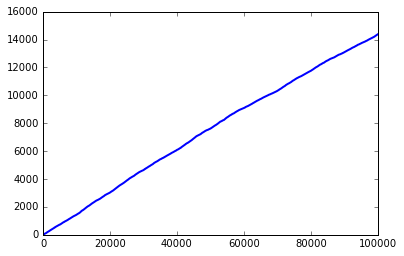
It looks like roughly linear growth but it is rather choppy. However, what is really wonderful about using code to experiment with in mathematics is that by changing a single value (where to test up to) we can recycle our code to look at the trend up to 100,000:

We can now step back and be much more confident in our assertion that the groth is fundamentally linear, with noise at the start disrupting the beautiful straight line.
Now we have a clear conjecture we can be much more targeted in our investigation. I would then encourage students to think that beyond a certain point (where?) the operation of replacing a number by a sum of its digits is decreasing, and so long term behaviour is determined by what has already happened for lower values. If we can then prove something about the distribution of the images being random between happy and unhappy numbers we would have an anlytic proof. Otherwise, we could do more investigation.
In this investigation it is important to note that I am not claiming the algorithm I give above to be especially efficient, only that it “works”, and the fact that it is able to generate meaningful data in a reasonable time on my laptop is “good enough”. The area of efficiency of operations (P vs NP Problem for example) is fascinating, but so often I feel that my time is more precious than that of the computer processor, and I tend to quick dirty code over elegent solution. Hopefully elegence will come in the mathematics I use to understand the experimental data I’ve generated.